
Results
DFE PERFORMANCE TABLES
Key Stage 1 and Key Stage 2 Results and link to DfE Performance Tables
We are extremely pleased with our end of KS2 results this year, but then we are always really pleased because they are the result of our children's hard work and determination and the outcome of the staff's dedication and care. We are always confident that the outcomes that our children achieve are the best that we could possibly be; a greater than average number of our children have special educational needs and there are various other challenges that our children overcome. We take huge pride in every child reaching their potential. This applies to children who are academically able where the government's expectation is too low and also to those children with additional needs where their best is a huge achievement for everyone who cares about them.
Honestly? Our results vary year on year. This is because we are a small school so our percentages bounce up and down, but also because sometimes we have children whose best is different. You can see from our results year on year that we have lots of children who achieve at Greater Depth but, as with all schools, we have a number of children who don't meet the Government's expected standard. Some children don't and as long as they all reach their best, that's okay. What's important is that we don't ever allow our children with high academic ability to achieve less than their best and we don't let them coast along having an easy time. All of our children, whatever their ability have high expectations placed upon them. Good self esteem comes from ALL children achieving but at their level.
Here are some of our results year on year for you to look at. Remember, it's about making sure that every child reaches their potential; this is giving the child an extra push, no matter their ability level and making sure everyone does their very best.
KS2 SATs Results 2024
These are our results for our mainstream only (without the Specialist Resource Provision)
These results include the Specialist Resource Provision

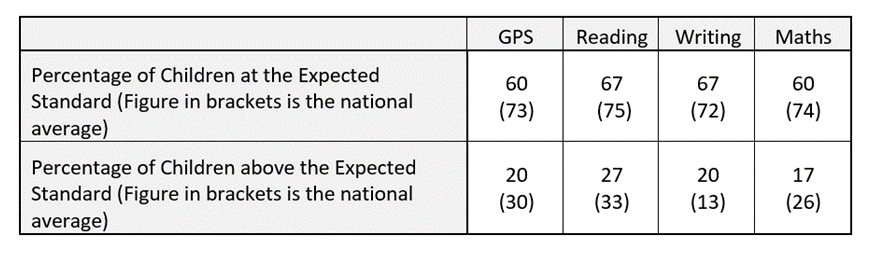
KS2 SATs Results 2025
You can see that our 2024 results were well above national average and we were very pleased with the children. We were even more pleased with our results from 2025, although they don't look as high as our results from 2024. Why were we so pleased? Because many of the children in this year group had additional needs and the team (and the children) worked incredibly hard to make sure that all children achieved their very best.
These are our results for our mainstream only (without the Specialist Resource Provision)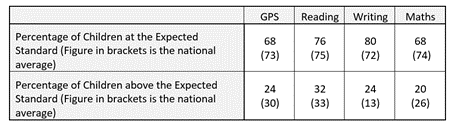
These results include the Specialist Resource Provision
Why do we separate out children from our Specialist Resource Provision?
The children in our Specialist Resource Provision have a diagnosis of autism. Their autism means that they need extra support in the school environment and so they attend our SRP so that they can have extra therapy, specially trained staff and a more tailored provision to meet their needs. They all have an EHCP which sets out targets for them. Whilst we strive to ensure that these children strive to meet the government's expected standard, they are also working to meet the targets on their EHCP and spend a chunk of their curriculum time taking part in groups and intervention to meet these targets. They simply don't have the same time to spend on the curriculum as others and their EHCP targets are more important. These children, just like all our children, have a value far more immense than their KS2 SATs scores and whether they have met the standard or not isn't a fair comparison.
Please follow click here to access the Department for Education performance data for Cage Green Primary School. On the DFE website, you can also compare the results for the school with those of other schools.
These charts are from the wesbite mentioned above that publishes the results for all children.
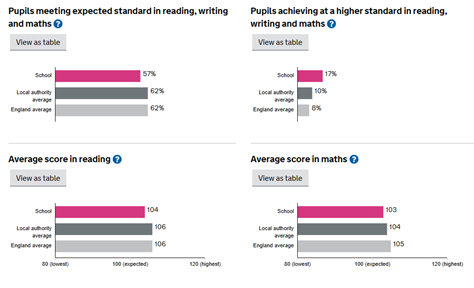
For comparison, our combined scores for mainstream are 60% for expected and 20% for the higher standard.